
Enterprise SaaS
Meridian Ops: one analytics platform, a different product for every tenant
A multi-tenant operations analytics platform for logistics companies. The hard part was not charts. It was letting each customer, role and region see exactly the data that is theirs.
- Role
- Lead product designer
- Users
- Operations managers, analysts, tenant admins
- Platform
- Web app, embedded dashboards
- Scope
- Research, IA, data viz, permissions model, design system
The challenge
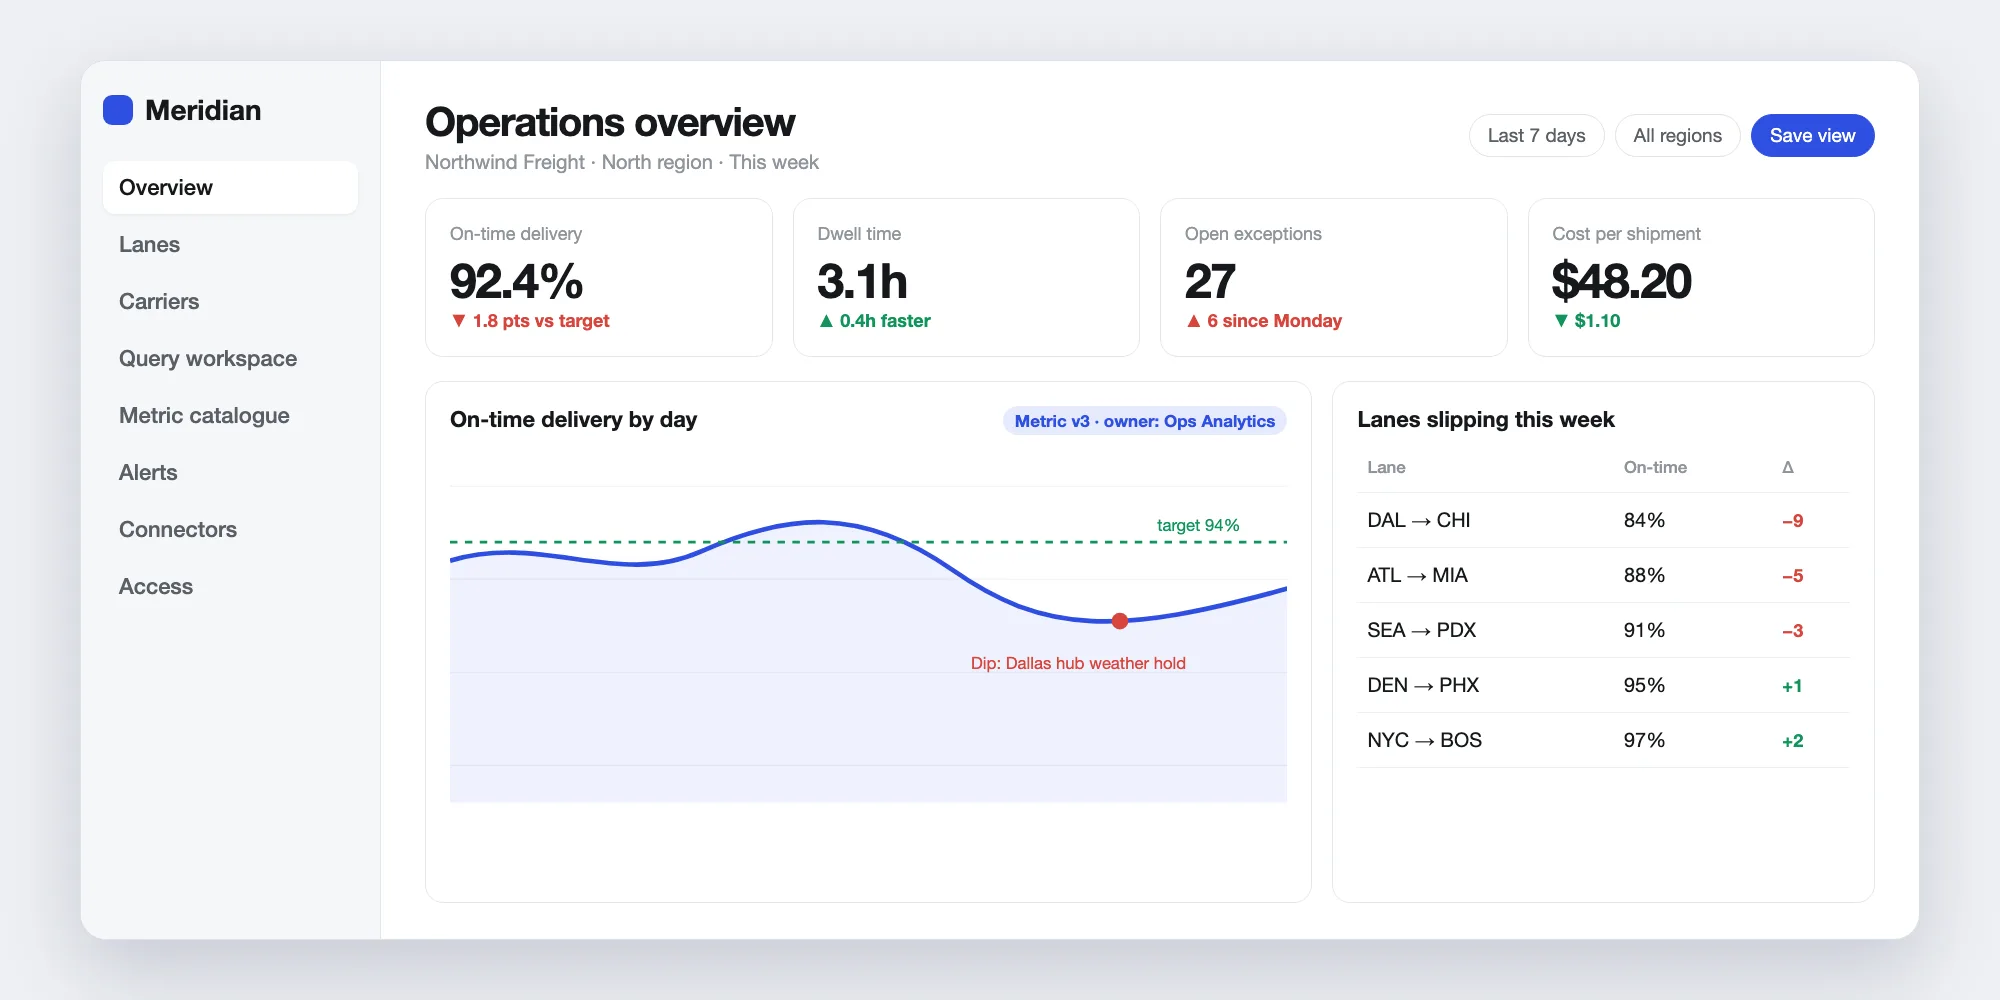
Operations teams were stitching together spreadsheets, vendor portals and a legacy BI tool to answer simple questions such as "which lanes are slipping this week and why?" The platform had to serve many companies at once, each with its own data sources, vocabulary and permissions, without becoming a pile of custom builds.
Who it is for
Three groups with different jobs shaped every decision.
- Operations managers: need a live picture of the day and a clear next action
- Analysts: need to ask new questions without writing SQL for every one
- Tenant admins: need to connect data, define roles and trust what is shown
Information architecture
The model separates what people look at from where it comes from. Metrics are defined once, in a shared catalogue, and every dashboard, alert and export reads from it.
- Workspaces: one per tenant, with regions and teams nested inside
- Metric catalogue: one definition per metric, versioned, with an owner
- Dashboards: composed from catalogue metrics, never from raw tables
- Views: saved filters that respect each person's permissions
Role based dashboards
Instead of one dashboard with everything, the home screen adapts to the role. A manager lands on exceptions and trends, an analyst lands on the query workspace, an admin lands on connector health. Every number links to its definition so people can check what it means before they act on it.
The query builder
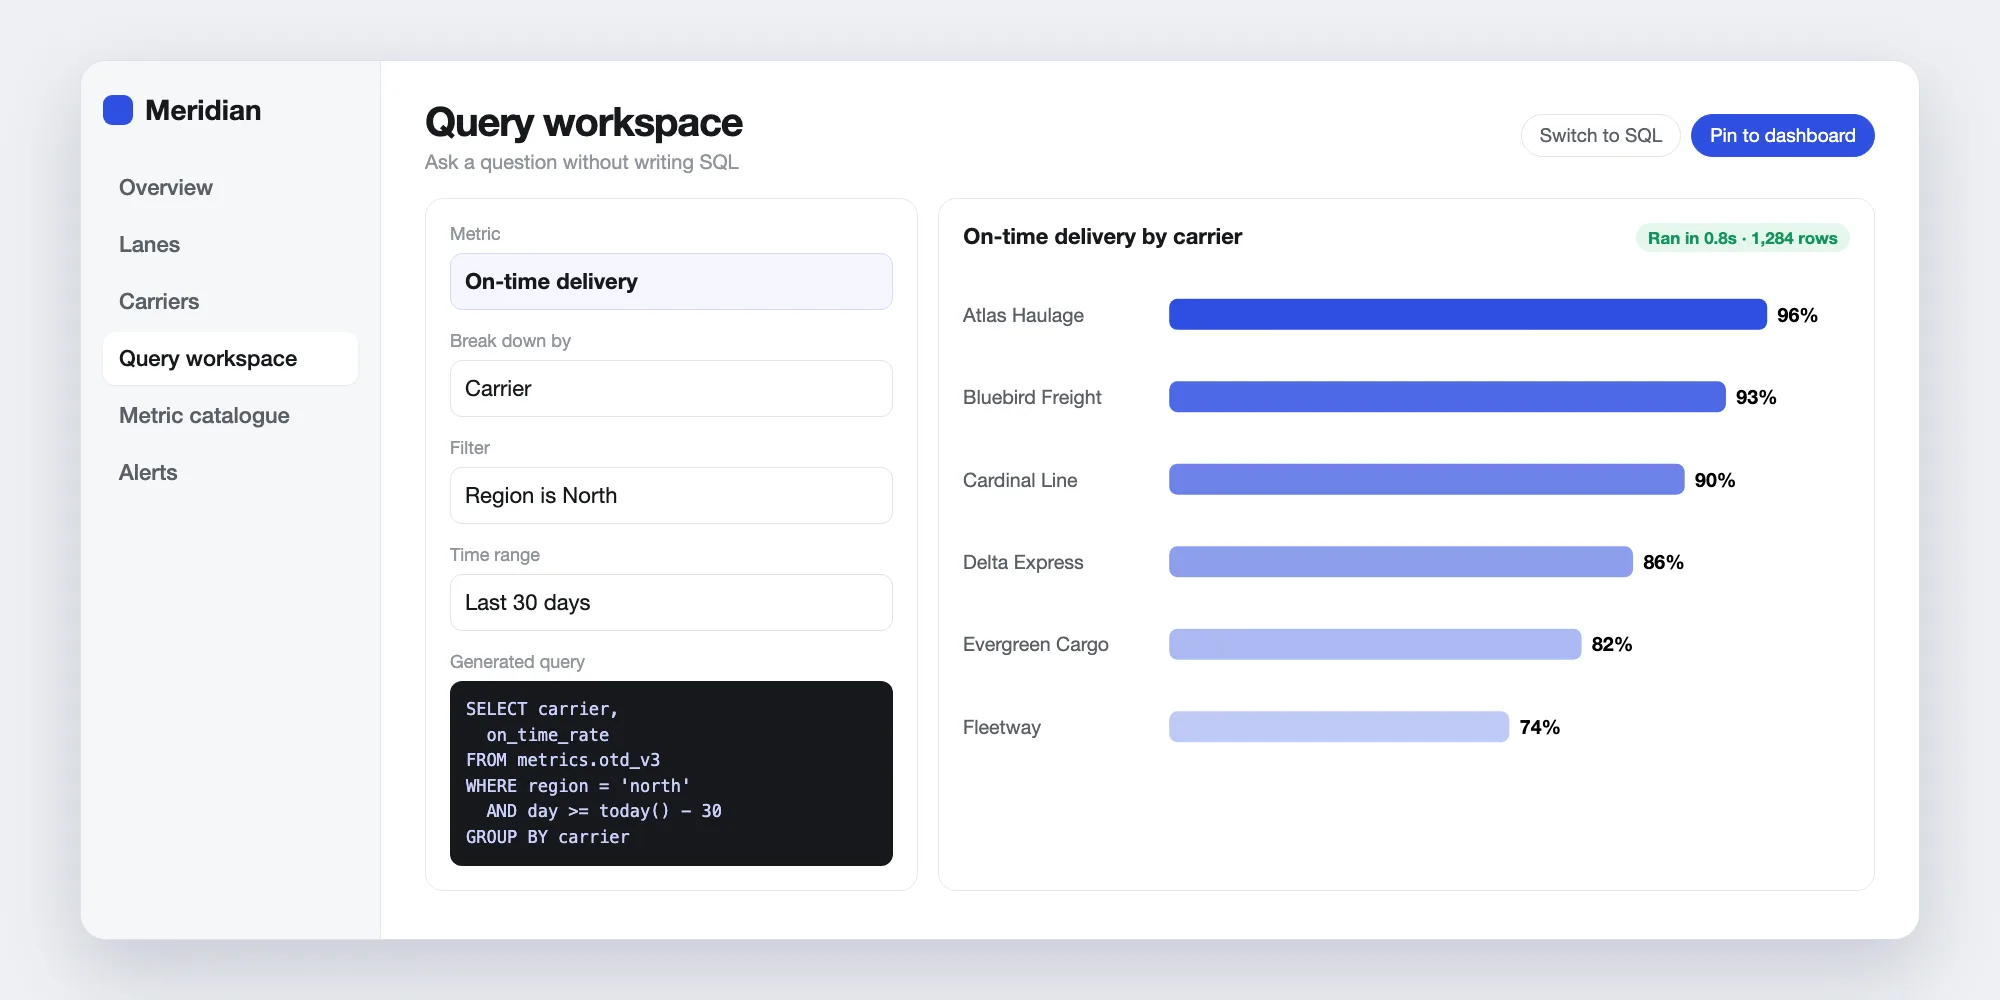
Analysts build questions by choosing a metric, a breakdown and a time range, with the generated query visible beside it. Experts can drop into SQL and non-experts never need to. Results can be pinned straight to a dashboard.
Permissions that make sense
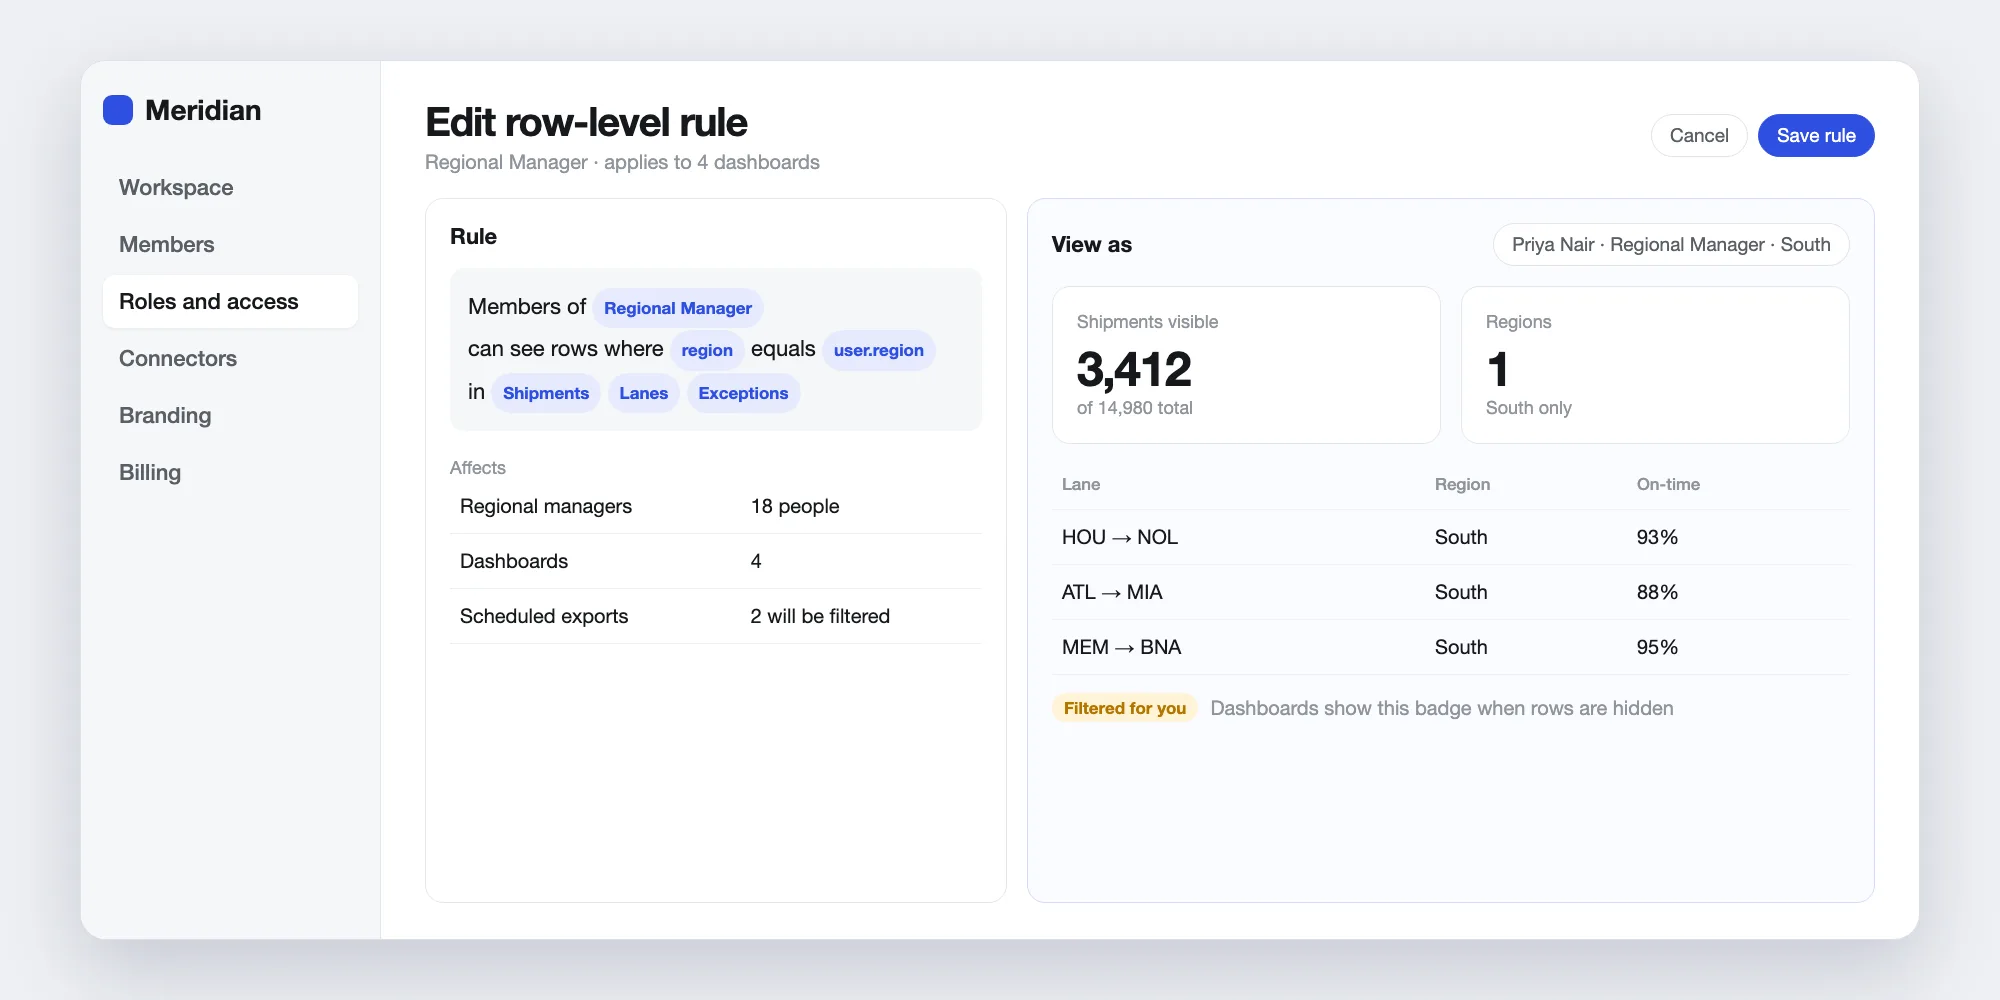
Row-level access is the riskiest part of a multi-tenant product, so it needed to be visible. Admins see a "view as" preview before saving a rule, and every dashboard shows a small badge when the data has been filtered for the viewer.
Alerting
Alerts are written as sentences, such as "when on-time delivery for the north region falls below target for two days", with a preview of how often it would have fired in the last month, so teams tune noise before it reaches anyone.
Design system
The product needed dense tables, many chart types and a theme per tenant. Tokens separate brand colours from semantic ones, and chart palettes are tested for colour-blind safety in light and dark.