
B2B SaaS, 2023
TaskFlow: cutting cognitive load in enterprise project management
Power users of an enterprise project tool were drowning in data. The redesign answered one question first: what do I need to do today?
- Role
- Lead product designer, end to end
- Users
- Enterprise project managers
- Year
- 2023
- Scope
- Research, IA, data visualization, accessibility
- +25%Daily active users on the new dashboard
- −15%Time to complete tasks
- 32 → 48NPS within three months
The challenge
TaskFlow is a powerful tool used by enterprise teams, but power users reported "dashboard fatigue". The interface was so cluttered that the simplest question, "What do I need to do today?", was hard to answer.
Discovery
I ran over-the-shoulder observation sessions with eight project managers and saw a pattern: people opened five or more tabs just to cross-reference task status.
“I spend more time managing the tool than managing my project.”
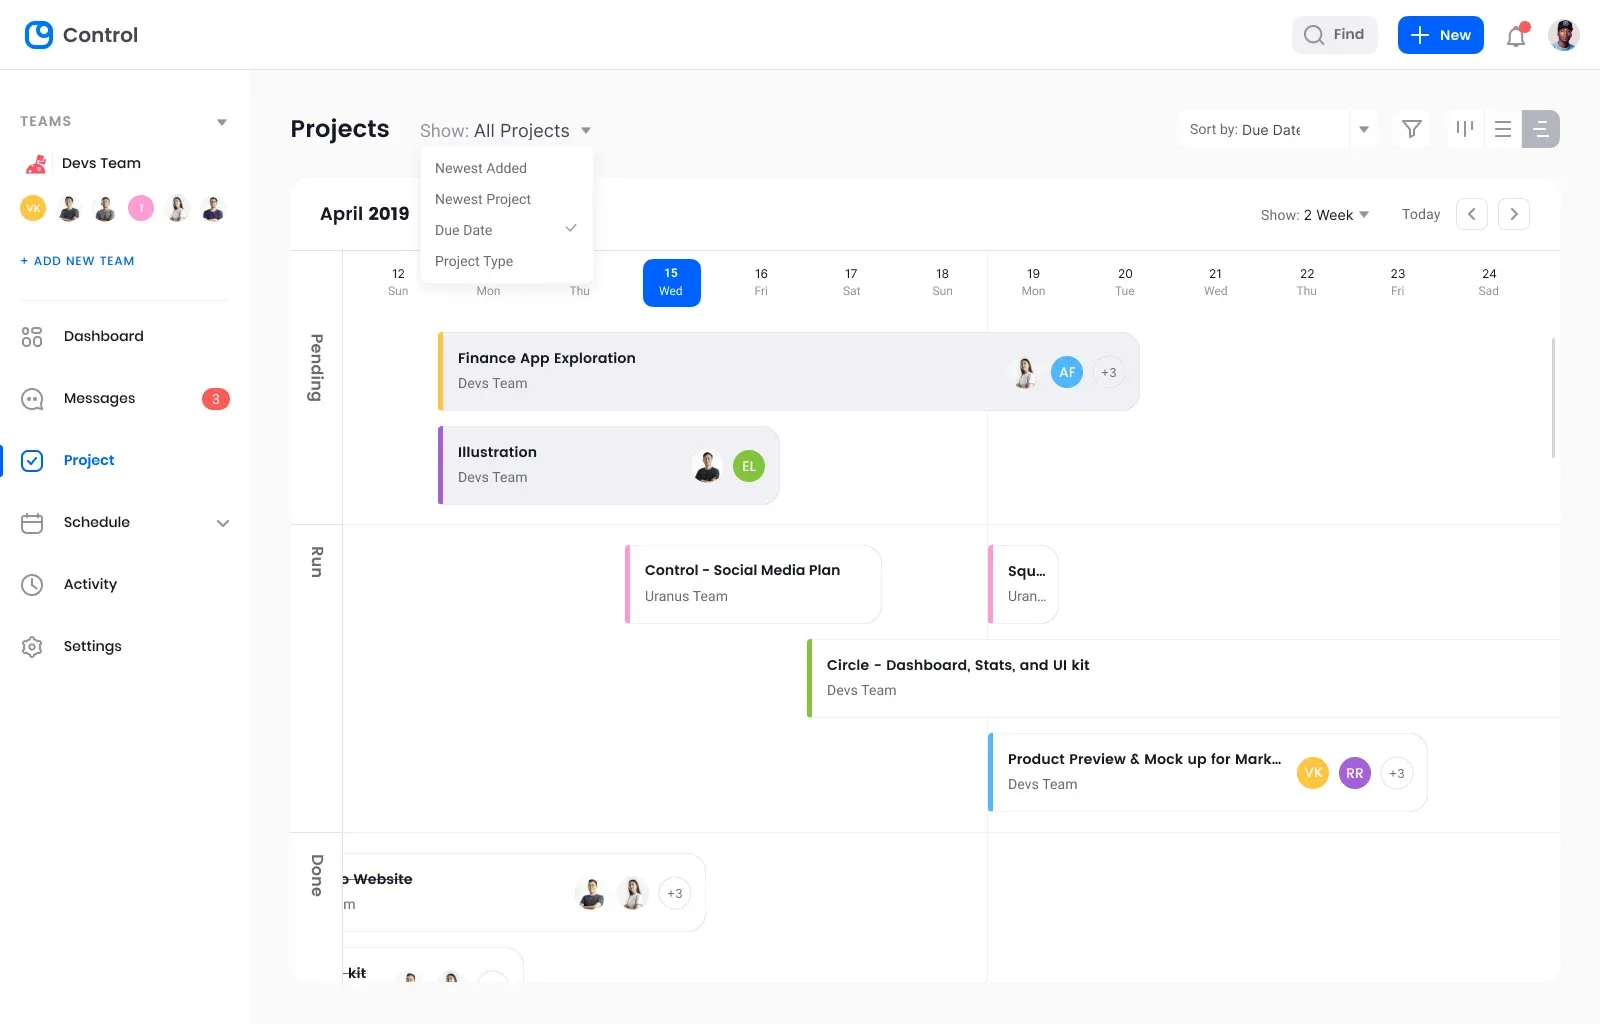
Key insight: the product wasn't missing features, it was missing context. Data was siloed across Gantt, Kanban and list views.
Strategy: contextual density
I rebuilt the information architecture around progressive disclosure, surfacing critical data first and letting people drill down only when needed.
- Unified view: a master table combining status, assignee and timeline.
- Smart filters: natural-language filtering, like "high priority tasks due this week".
- Focus mode: hides navigation and sidebars for deep work.
Designing for density
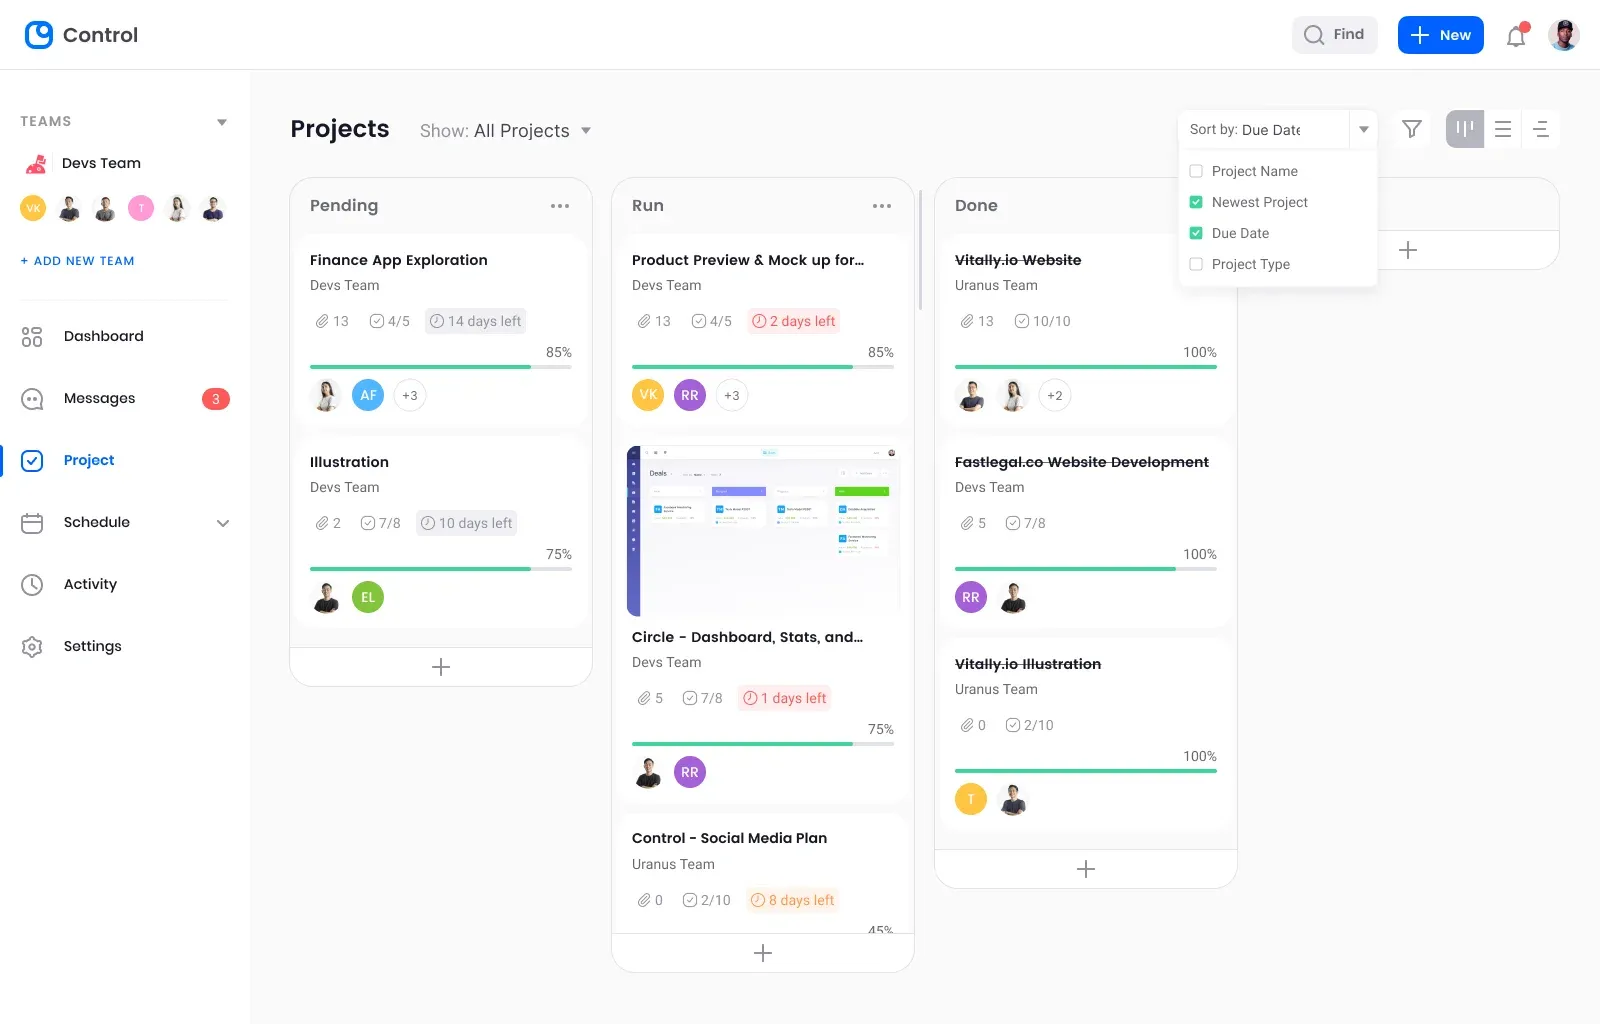
A strict 4px grid and restrained color coding created hierarchy without overwhelming the eye.
The health indicator
Instead of raw dates, a computed health status (on track, at risk or delayed) removes the mental math of working out what's late.
Accessibility
The new design met WCAG 2.1 AA:
- Keyboard navigation with
JandKto move between rows. - Screen readers get proper
scopeattributes and labels on every data table. - Color independence: every status pairs color with an icon.
Impact
Post-launch analytics in Mixpanel showed:
- Daily active users on the dashboard up 25%.
- Time to complete tasks down 15%.
- NPS up from 32 to 48 within three months.